Financial Transactions to Knowledge graphs
In the financial world, data is everywhere—but insight is hard to find.
Banks, insurance companies, and financial service providers generate massive volumes of data every day: customer profiles, transaction records, compliance logs, audit trails, support tickets, and more. This data comes from different teams, tools, and systems—often formatted differently, stored in silos, and lacking a unified view.
"While every piece of data holds potential, the real challenge is making sense of it all".
The Business Problem
Today, most financial institutions face one or more of the following challenges:
-
Disjointed data across systems Information about a single customer or transaction is often spread across multiple systems—core banking, CRM, risk, support, and more. Connecting these pieces is time-consuming and error-prone.
-
No clear view of relationships There’s no easy way to trace how customers, accounts, merchants, or transactions are related. This makes it difficult to investigate fraud, assess risk, or understand customer behavior.
-
Manual effort for audits and compliance Teams spend countless hours digging through data to prepare for audits, respond to regulatory requests, or prove due diligence.
-
Slow investigations and risk assessments Identifying suspicious patterns or tracing transaction histories often requires writing custom queries, inspecting records one by one, and involving multiple teams.
Turning Financial Transactions into a Knowledge Graph
To solve these problems, we built a solution that organizes and connects fragmented financial transactions into a knowledge graph. This approach helps businesses move from disconnected records to a clear, visual, and queryable map of relationships.
For demonstration purposes, we used banking transaction data—including customer details, accounts, payments, and Loan details —to show how different entities and events can be extracted, linked, and visualized meaningfully.
Here’s how it works:
Step 1: Identify key entities and relationships
We extract core business entities—like Customer, Account, Transaction, Bank, Branch, Device—and define how they relate. For example:
- A Customer owns an Account
- An Account has transaction Transaction
- A Transaction was processed by a Transactor
- A Transaction associated with Account
Step 2: Clean and standardize the structure
We ensure that similar concepts are treated consistently, even if they originally came from different formats or systems. This forms the foundation of a clear and unified schema.
Step 3: Populate the knowledge graph
Using the schema, we connect real-world data points into a graph—capturing both entities and the relationships between them. Each connection helps tell the full story behind customer actions, transaction paths, and organizational structure.
Step 4: Visualize and analyze
The final output is an interactive graph that gives teams the ability to explore, search, and analyze data with context. Instead of reading rows of data, teams can follow connections, spot anomalies, and ask better questions.
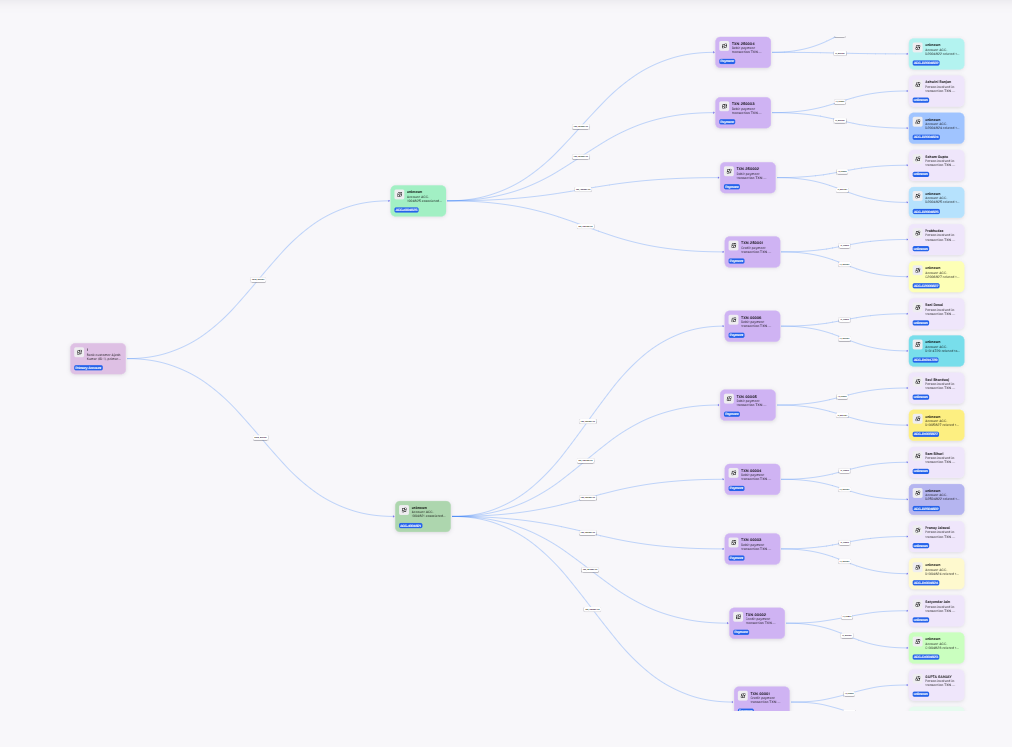
Visual Representation of a Financial Knowledge Graph
1.Complete Financial Knowledge Graph Overview
 2. Zoomed-In View of the Financial Knowledge Graph
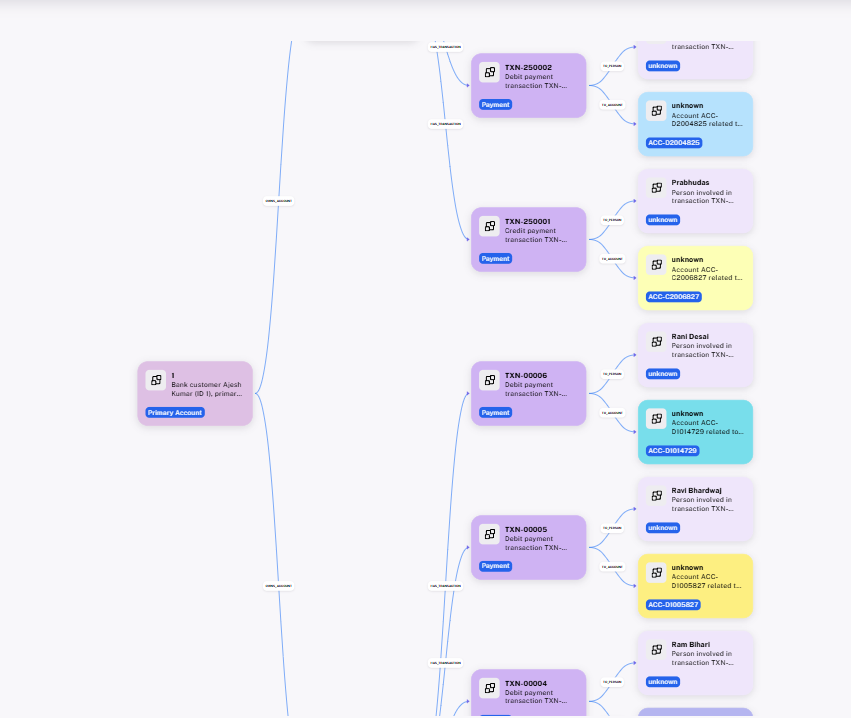
What the Knowledge Graph Looks Like (Figure Description)
Imagine a central node labeled “Customer A”. Connected to it are:
- A Bank Account node linked with owns
- Several Transactions, each linked with initiated
- A Transactor, involved in transaction
Each node has details (like timestamps), and every link shows how the entities interact. This graph lets you trace everything from a transaction to its merchant, device used, and even customer support trail—all in one view.
The Business Impact
By moving from fragmented records to a connected knowledge graph, finance teams unlock powerful new capabilities:
-
Faster fraud detection Quickly trace unusual activity paths and identify high-risk accounts or merchants.
-
Simpler audits and compliance Provide clear, structured evidence of customer histories, transaction flows, and internal reviews.
-
Stronger risk management Analyze entity relationships to surface hidden exposures or suspicious behavior across accounts.
-
Unified customer understanding See the full picture of a customer’s relationship with the business—products used, interactions made, issues raised.
-
Time and cost savings Reduce manual work, simplify data analysis, and empower teams to work with context—not guesswork.
Conclusion
Financial data is rich—but scattered. We’ve built a solution that connects the dots, turning fragmented records into an understandable structure. With a knowledge graph, businesses no longer need to search blindly—they can navigate, understand, and act with confidence.
This isn’t just a new way to look at data.
Do you have any comments or thoughts about this post? Please drop us a note at: Contact Us We would love to hear from you!