Making Sense of Complex Information with AI — Through the Lens of Ramayana
Hey there 👋
What if your favorite story could think, connect the dots, and tell you more than you ever imagined?
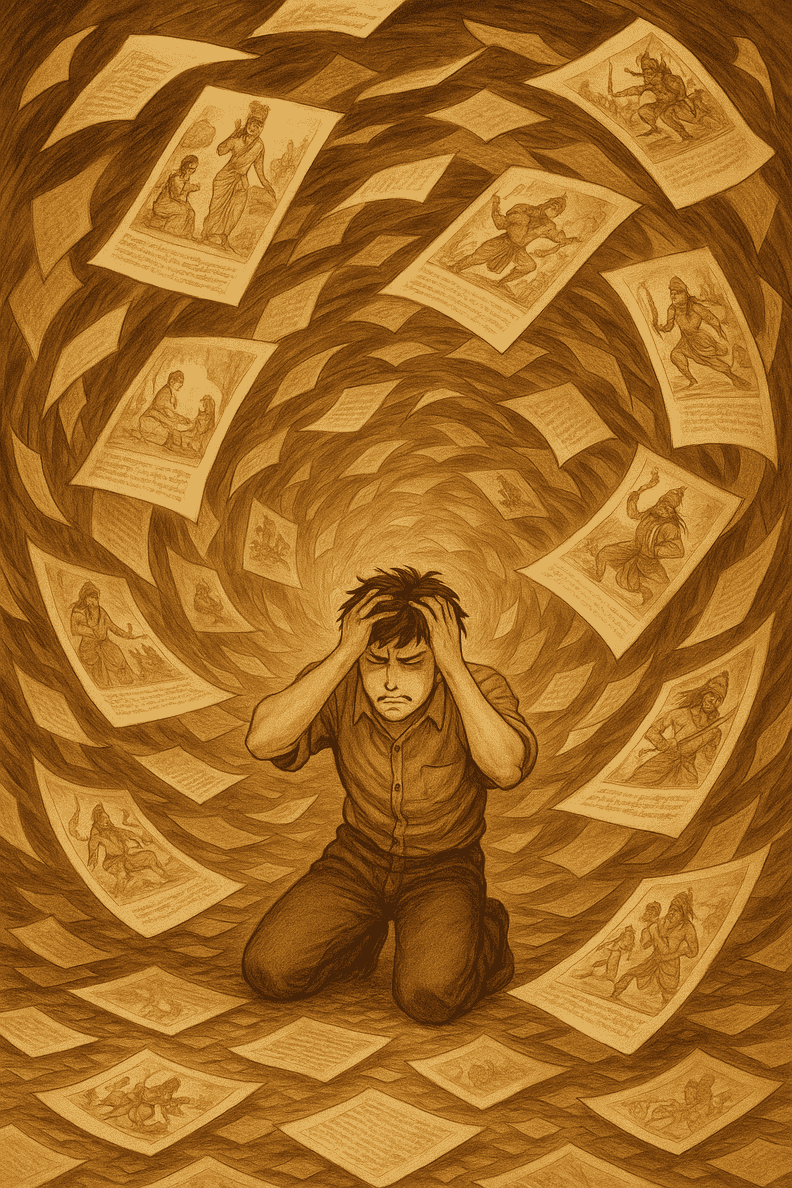
Imagine opening a book, but instead of neatly arranged chapters, you find thousands of scattered pages. Somewhere in there are the characters, their adventures, and how they’re all connected but it’s up to you to piece it together.
In this blog, we’ll explore how we turned one of the most celebrated epics, the Ramayana, into a connected “map of ideas” — a way for both people and computers to see not just the facts, but how those facts relate to each other.
Well, You Might Be Wondering, Why the Ramayana?
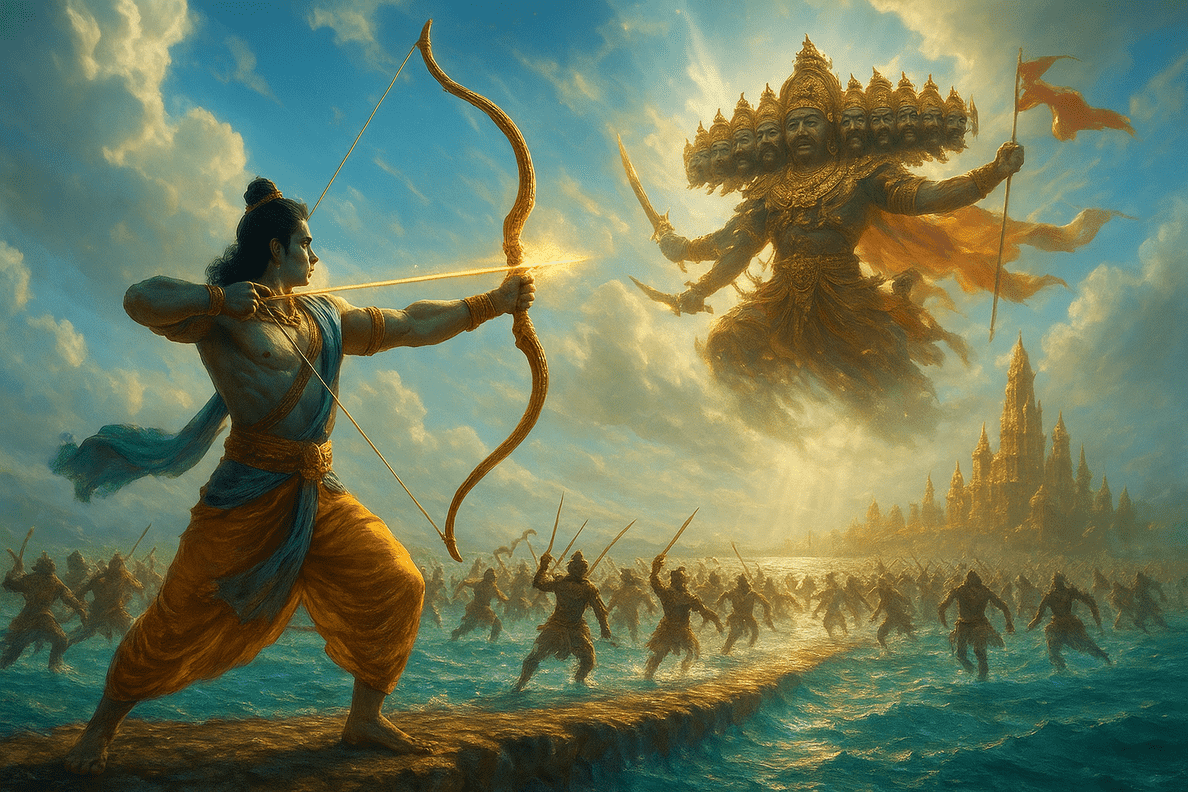
We didn’t choose it at random. The Ramayana is rich in narrative detail, with well-defined characters, locations, and events. More importantly, it naturally lends itself to a connected map:
It has characters like Rama, Sita, Ravana, and Hanuman that are easy to identify, relationships such as husband-of and enemy-of that are clearly defined, and a storyline that spans multiple places and intertwined events.
All of this made it the perfect example for showing how complex stories can be organized into something searchable and easy to explore.
From Story to Map – How We Made It Happen
Now that we had our story, the question became: how do we actually turn hundreds of pages into something you can explore like a map?
That’s where the real work and a little smart tech came in.
Before we could build our “map,” we needed to understand what exactly we were creating.
Let’s understand What is a Knowledge Graph ?
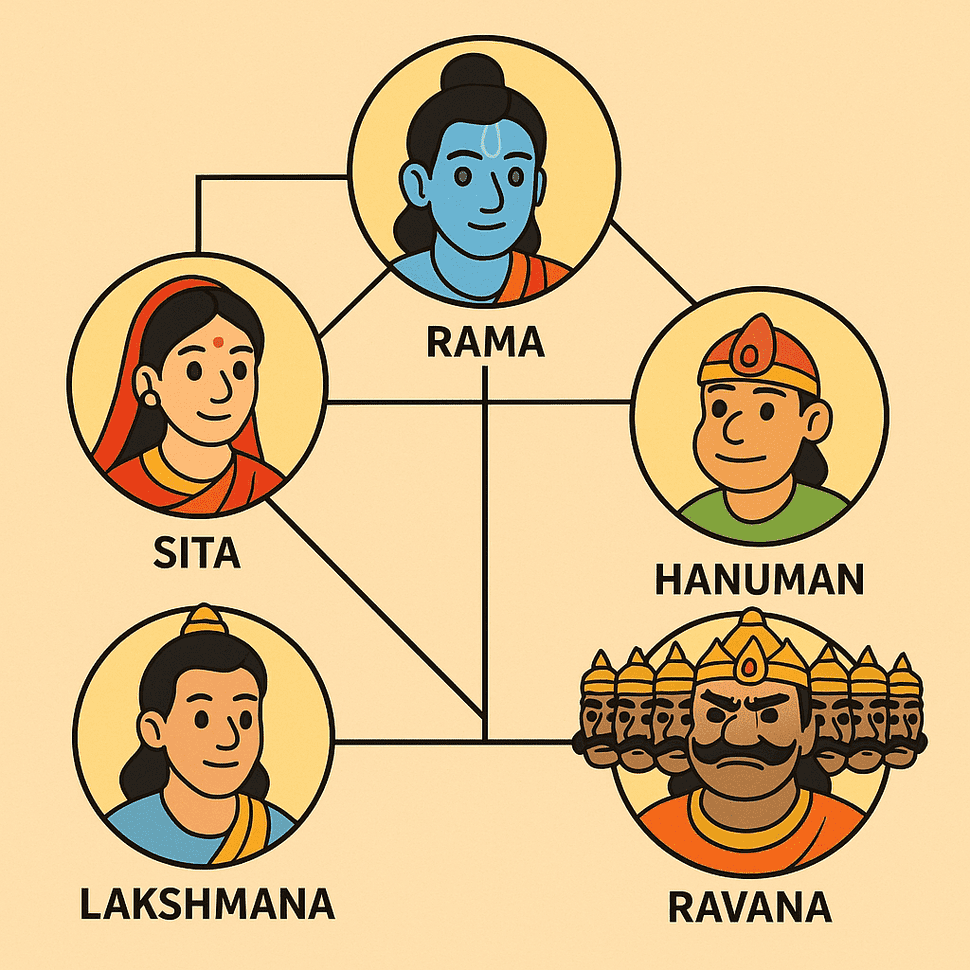
A knowledge graph is like a mind map, but for computers — every person, place, or event becomes a point, and the lines connecting them show how they’re related. Imagine a giant detective board where photos are connected with strings, only here, the “photos” are characters, places, and events from the Ramayana.
We began with the raw story, hundreds of pages of text. First, we used smart tools to read through the entire epic and pick out important elements like names of characters, locations, and major events.
We taught the AI knowledge assistant to recognize broad categories instead of names of the characters as you can see in the image below. At the start, all people were labelled as “CHARACTER,” all places as “LOCATION,” and so on. This gave us a rough but complete outline of the story’s “cast” and “setting.”
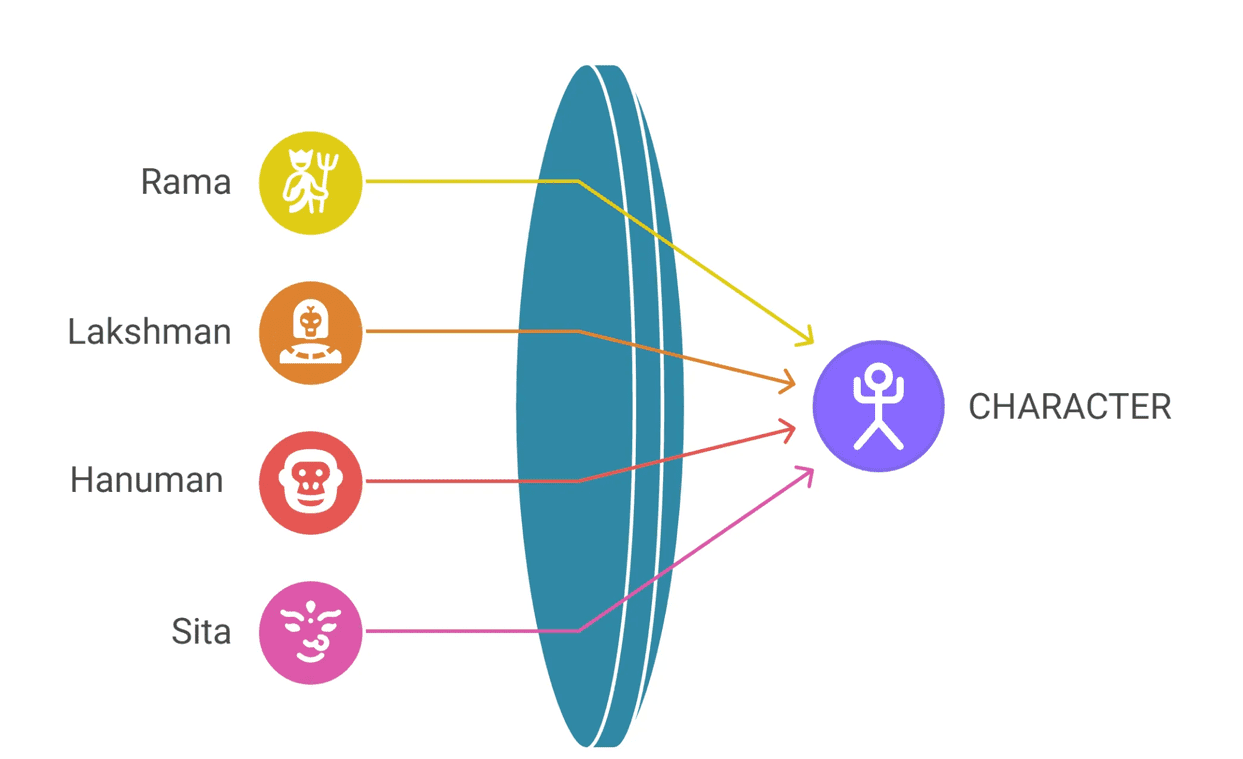
Then, when two names meant the same thing — for example, “Lord Rama” and “Ram” both refer to the same person. We taught the AI knowledge assistant to reduce repetition and culminate all of it into one node i.e. Ram as you can see in the image below.
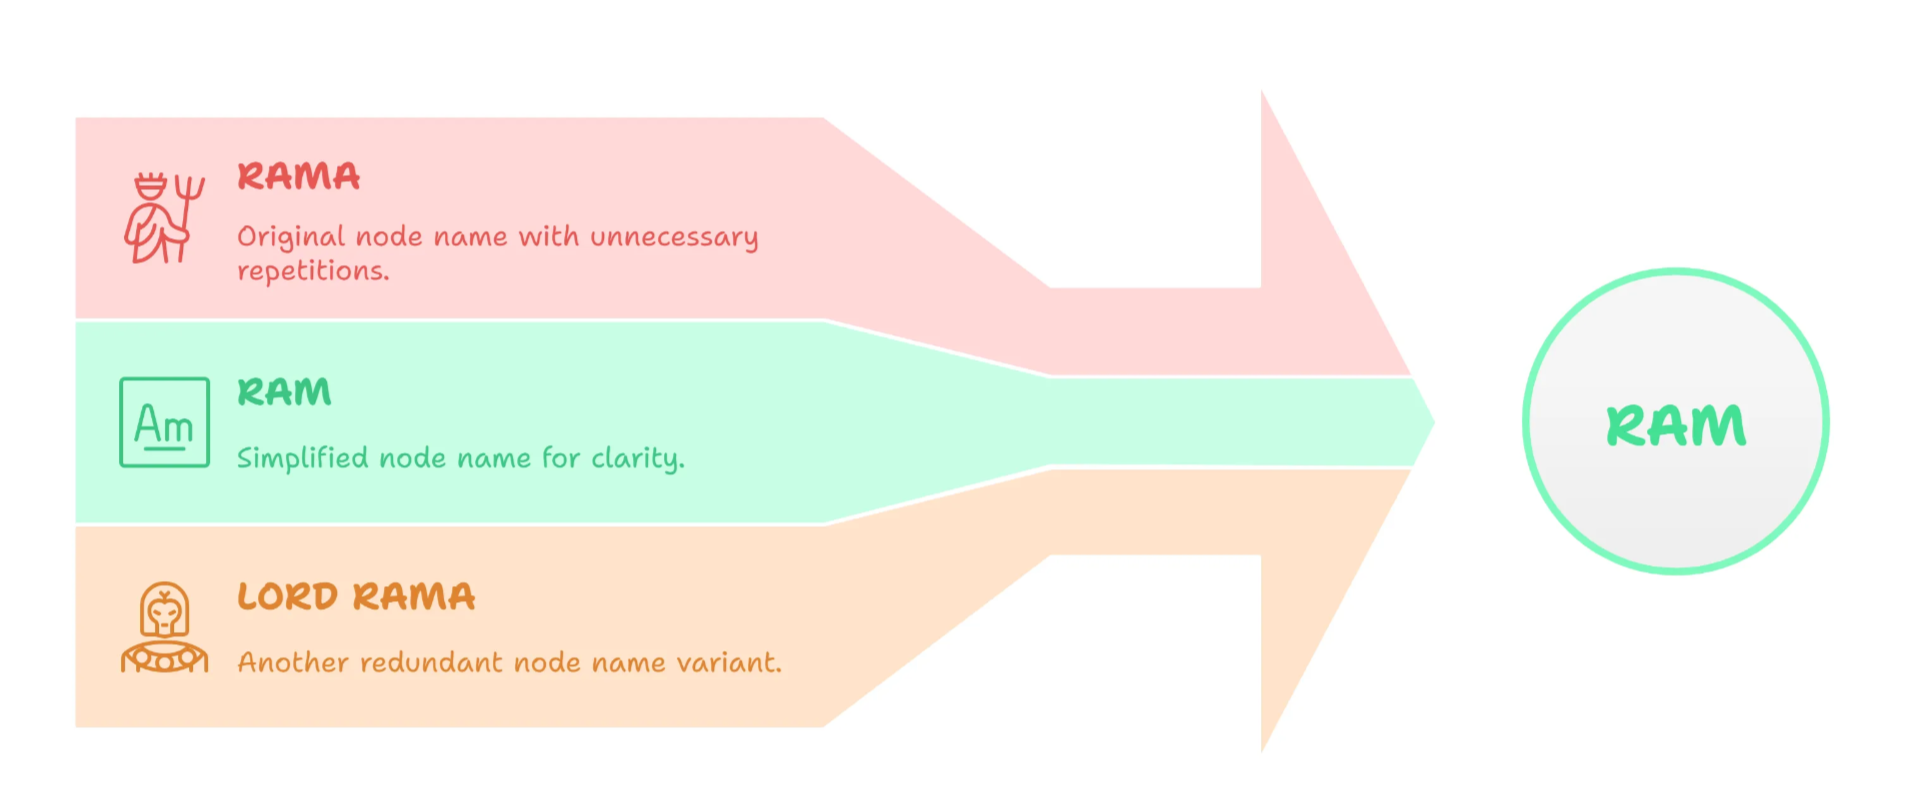
This helped the map tell a clearer story and avoid confusion. Throughout this process, the technology did the heavy lifting of reading and sorting, but we stepped in often to guide it, correct mistakes, and make sure the relationships matched the real storyline.
By the end of this stage, all the scattered details of The Ramayana had been sorted, connected, and refined and we were finally ready to see what the complete picture looked like.
Seeing the Story Come Alive
When we stepped back to view the final creation, it was like watching the Ramayana breathe. Characters, locations, and events were no longer trapped in paragraphs — they were part of a living, clickable web that showed the entire epic at a glance.
With a few clicks, we could trace connections between characters, pinpoint where events happened, and follow the journey as it moved from one location to another. What was once just text became a story you could navigate visually.
Of course, building it wasn’t without some unexpected and often amusing surprises.
When the Map Got a Little Too Creative 😬
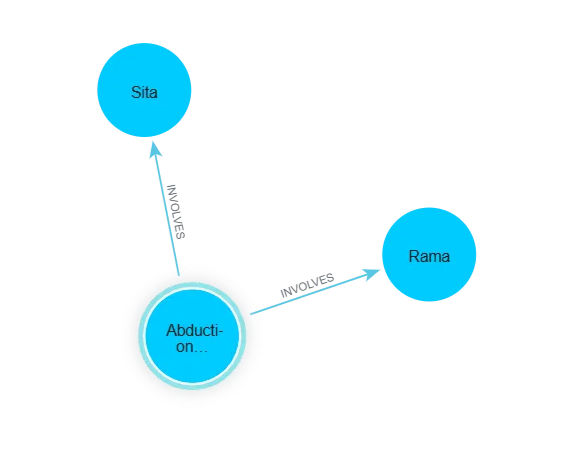
One time, the AI knowledge assistant confidently decided that Rama was somehow involved in Sita’s abduction !
That’s a very terrible mistake to make right ?!
Because anyone who knows The Ramayana understands that Rama was the husband of Sita and Ravana abducted Sita.
These little quirks made us laugh, but they were also a reminder: even the smartest tools need a human touch to keep the story accurate. Once we stepped in and made corrections, the network felt complete and true to the epic.
Wrapping It Up
What began as hundreds of scattered pages from an ancient epic became a living network of characters, places, and events - a way to see the Ramayana rather than just read it.
But this isn’t just about one story. The same approach can help make sense of complex information anywhere from untangling historical records to mapping a company’s data or even organizing your own research notes.
In the end, it’s about more than technology. It’s about finding clarity in complexity, revealing the hidden connections, and turning information into something you can truly explore.
And that, we believe, is a story worth telling, whether it’s from a timeless epic or the data shaping our world today.
Eager to know more? We will be releasing a technical deep dive on how we achieved this, very soon! Stay tuned!
Do you have any comments or thoughts about this post? Please drop us a note at: Contact us
We would love to hear from you!